DATAXCHANGE CNC MANUFACTURING DASHBOARDS OVERVIEW
Collecting shop floor data is one thing; making it useful is another. There is clearly value to having historical and real-time data, but having the data in a meaningful format as production events are happening greatly increases the value of any machine data collection system. Scytec DataXchange provides user-configurable real-time manufacturing dashboards that expose the data necessary for evolving your shop floor.
With DataXchange, you don’t have to be on the shop floor to view manufacturing data. The manufacturing dashboards are available on your browser, iOS, and Android mobile devices, allowing you to remotely view machine data in real time from home or on the road.
Visual information provided by the DataXchange manufacturing dashboards helps articulate potential issues more clearly and delivers metrics to stakeholders throughout your organization through user interfaces uniquely configured to suit the needs of specific users or function areas. When manufacturing data becomes accessible to more people, it enables faster decisions along with the ability to accelerate their respective workflows, leading to faster and better communication of information.
Endlessly Configurable Dashboards
If not exposed correctly, the shop floor data that is collected is useless. DataXchange addresses this by offering an unlimited number of user-configurable dashboards showing the necessary information for your shop floor improvement. Each dashboard screen shows the appropriate data for the area where the dashboard is being displayed, whether it shows simple or extensive reported shop floor metrics.
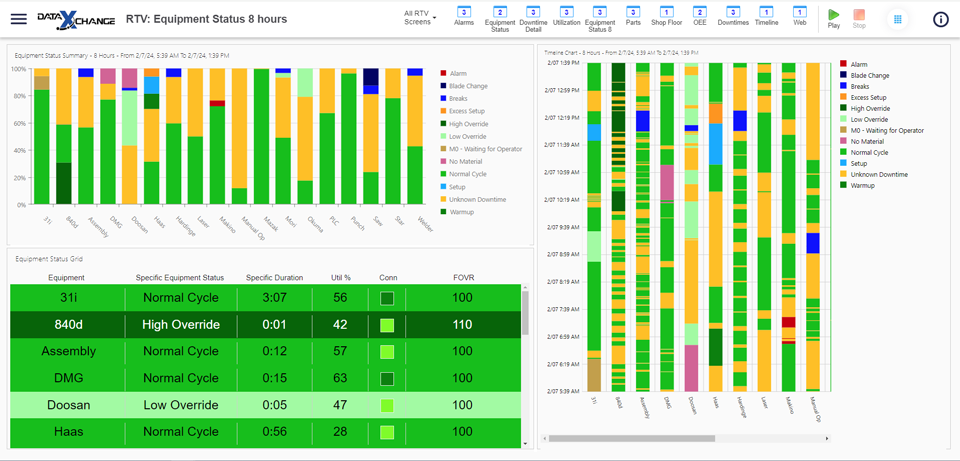
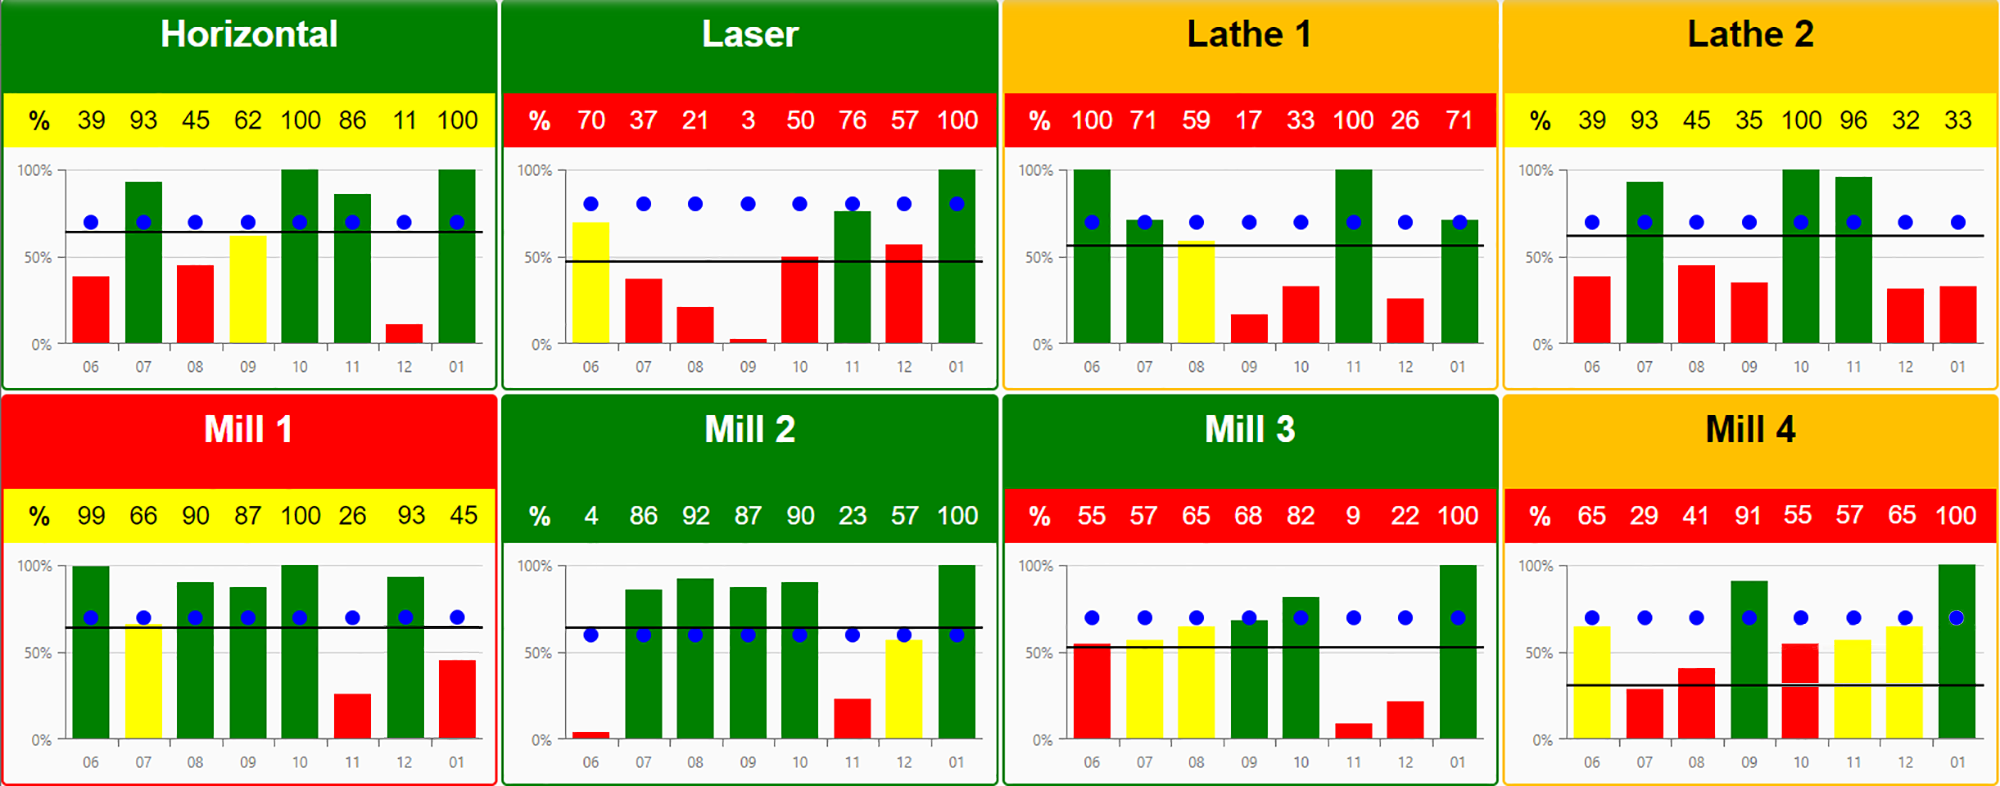
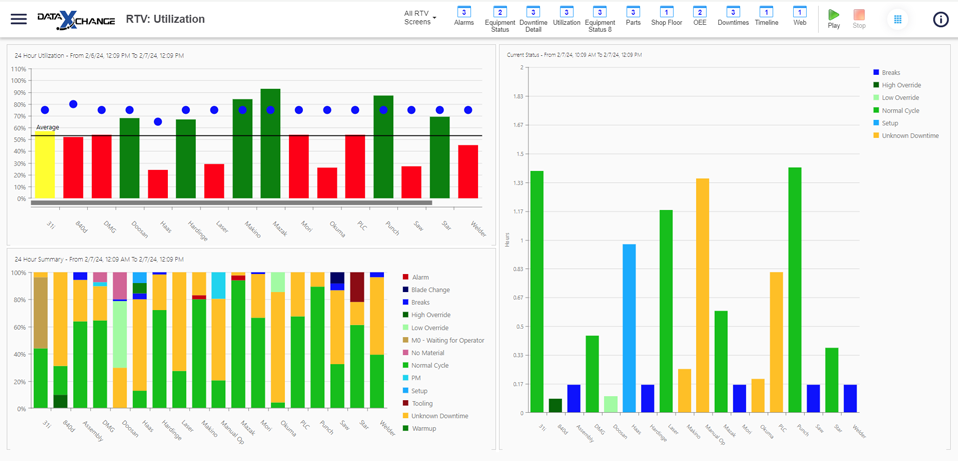
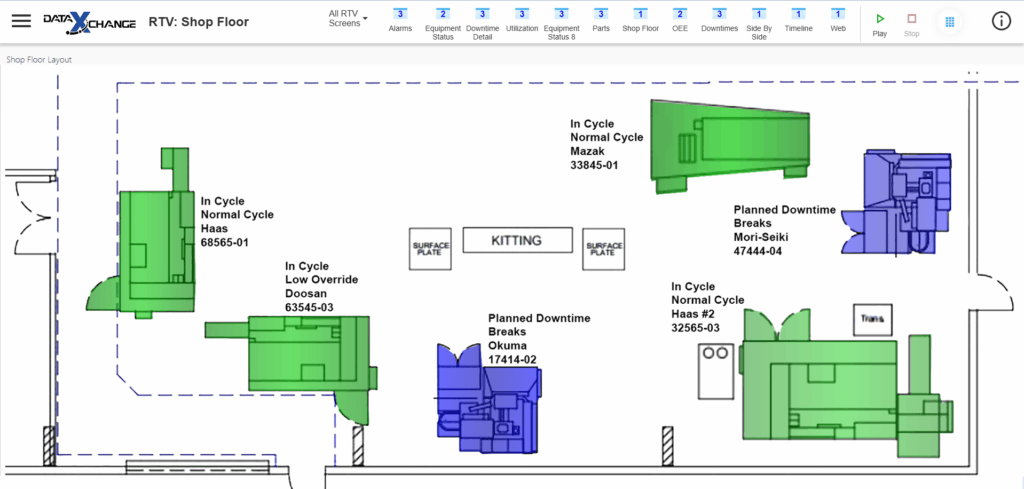
DataXchange can show one chart or multiple, such as the RTV screenshot below. The dashboard views on the screen can show needed shop floor metrics like the current status of the equipment, part counts, target utilization, OEE metrics, downtime Pareto’s, downtime summaries, timeline views, shop floor layouts, and much more. In addition, each of the dashboard views can be configured to show your production data in a variety of different ways, providing the metrics necessary for solving your specific shop floor issues.
The DataXchange Dashboard Types
The Equipment View – Is a powerful dashboard tool for monitoring the shop floor. This card-based real-time manufacturing dashboard allows for a wide variety of displayed data points to be retrieved from your shop floor equipment. The Equipment View is meant to be displayed on a screen on your shop floor with Data Display, the mobile and browser-based reporting tool for DataXchange. The Equipment View includes the ability to toggle on and off a host of data points, like the current status of the equipment, duration of the status, good/scrap parts counts, temperature, alarm counts, feed rate, rapid, spindle overrides, pressure, and more. You can also see machine utilization and the number of good and scrap parts created in the shift history section of the Equipment View. The Equipment View was designed to be viewed on a screen in your production facility so that all employees can see more, know more, and run better.
The Real Time List – Is a web-based dashboard component that provides a real-time, continuously updated view of equipment status and key operational data. The grid is fully configurable, allowing DataXchange users to show or hide specific columns to tailor the view based on their unique data collection and reporting needs.
The Equipment Summation List – Provides a comprehensive, aggregated view of machine performance by displaying total status time for each selected piece of equipment, along with part counts and numerical custom variable values. This flexible dashboard component can be used for both historical analysis and real-time monitoring, giving manufacturers the ability to track performance trends and make data-driven decisions with ease.
The Real Time Viewer (RTV) – Is a real-time manufacturing dashboard feature provided by Scytec DataXchange machine monitoring that is available in the browser and mobile-based Data Display shop floor monitoring tool. The RTV allows user and group-based dashboards to be created for your most needed manufacturing charts, reports, and more for improving your shop floor performance. The Dashboards that can be created in the Real Time Viewer are unlimited and meant to be displayed on a screen on your shop floor, and can be set to rotate at user-determined intervals through all the dashboard screens you create. The collected data from your shop floor equipment allows manufacturers to accurately know what is happening right now and not later.
RTV Designer – DataXchange offers a unique and streamlined way of creating your manufacturing dashboards via the RTV Designer. The RTV Designer can be accessed in the browser-based Data Display reporting tool. With the RTV Designer, manufacturers have the ability to configure and arrange their manufacturing dashboards to their heart’s content with the needed DataXchange charts and reports, enabling smarter data-driven decision making. The RTV Designer allows manufacturers to add their needed DataXchange charts, reports, and other useful items like Power BI dashboards, maintenance-related information, and web pages to their manufacturing dashboards.
HOW YOUR SHOP FLOOR DATA IS DISPLAYED
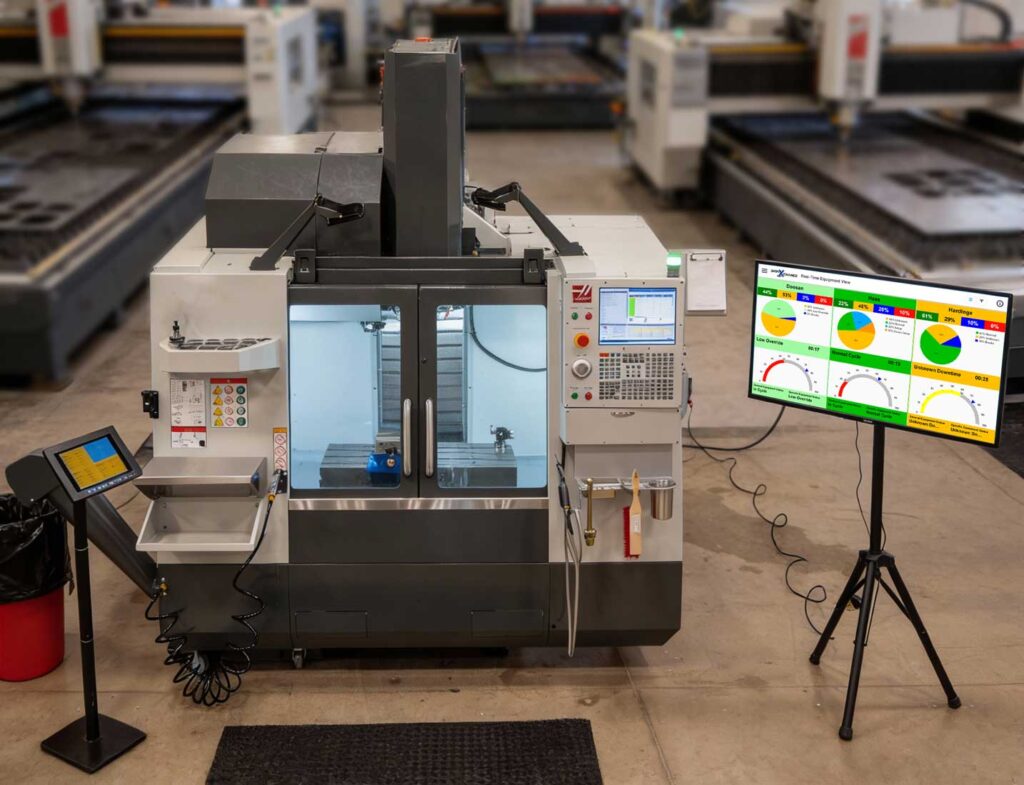
With DataXchange machine monitoring, your shop floor personnel, from operators up to C Suite executives, can view their manufacturing dashboards remotely or in person from many convenient devices, including smartphones, tablets, laptops, and desktop computers, as well as televisions. You can get the full DataXchange experience by pairing your manufacturing dashboards with the DataXchange Operator Data Interface (ODI), which supplements the automatically collected statuses from your production equipment.
DASHBOARD OFFERINGS WITH DATAXCHANGE
Rotating through Continuous Improvement – The Scytec DataXchange Real Time Viewer has customizable rotation functionality, allowing the configuration of rotating through multiple screens automatically. The rotation functionality of your manufacturing dashboards allows one screen to view an unlimited amount of information, such as having one screen display overall machine utilization summaries while another screen shows the details of specific machining centers. The rotation can also include Excel documents, show floor layout views, OEE, and maintenance-related information.
Personal and Group Dashboards – The visual dashboards in DataXchange can be configured by each user for their intended use, such as machining cells. Personal dashboards allow users to customize part of the interface to suit their individual needs. Multiple personal dashboards can be created, providing quick access to a variety of different information.
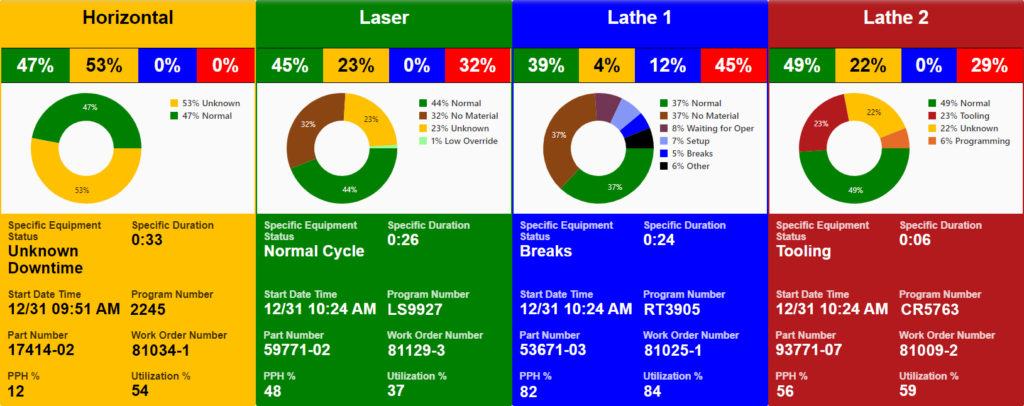
For example, you can configure a dashboard for machine operators that displays machine data summarizing the amount of time in a normal cycle status, in downtime, and low feedrate override; then configure a different view displaying an OEE dashboard for shop floor managers that displays data on an entire functional area, such as a manufacturing cell.
Browser View – The Real-Time Viewer has a built-in Web Browser View. This feature allows for an internal or external web page to be displayed within the DataXchange dashboards. The Browser View can provide value by displaying company messages, data from an internal company website, ERP information, and more.
Automatic Login -TV monitors can be set up on the shop floor by each machining cell, with the Real Time Viewer configured to show the appropriate equipment for each cell. The PCs are configured to log in automatically, and then Scytec DataXchange will automatically launch, log in, open the Real Time Viewer, and launch the appropriate screen for display in the cell.
DataXchange Manufacturing Dashboards Video
Watch this video to learn more about the Scytec DataXchange manufacturing dashboards and what they do to increase shop floor performance.
Common Dashboard Views and What Data They Present
Below you will find some examples of common DataXchange manufacturing dashboards and a description of the collected data that is presented. Many dashboards come standard with DataXchange, and users have the ability to craft their own to eliminate their specific production concerns.


